
Crime Analytics & Investigation Monitoring Dashboard
A district-level police department implemented a centralized crime reporting and analytics dashboard to gain real-time visibility into case registrations, investigation progress, and officer workload.
- 10 min read
Overview
A district-level police department implemented a centralized crime reporting and analytics dashboard to gain real-time visibility into case registrations, investigation progress, and officer workload.
The system consolidates data across multiple police stations, officers, and crime categories, enabling leadership to monitor operations, identify bottlenecks, and improve investigation efficiency.
Business Challenge
Crime data was distributed across multiple systems and manual records, making it difficult to get a unified view of ongoing investigations.
Key operational challenges included:
- Limited visibility into case status and investigation progress
- Difficulty in tracking officer workload and case duration
- Delays in identifying pending investigations and bottlenecks
- Lack of centralized insights across crime types, locations, and police stations
- Inefficient reporting processes for leadership review
As a result, decision-making was reactive, and monitoring performance across stations required significant manual effort
Solution
A Power BI-based Crime Reporting Dashboard was deployed to unify and visualize crime data in a single, interactive interface.
The dashboard provides:
- Real-time tracking of total cases, chargesheet status, and pending investigations
- Breakdown of crime types such as theft, burglary, robbery, and serious offenses
- Analysis of complaint modes (written, eFIR, oral, etc.)
- Monthly trends to monitor crime patterns over time
- Police station-wise insights into case closure and pending workload
- Investigation officer (IO) performance tracking, including case load and investigation duration
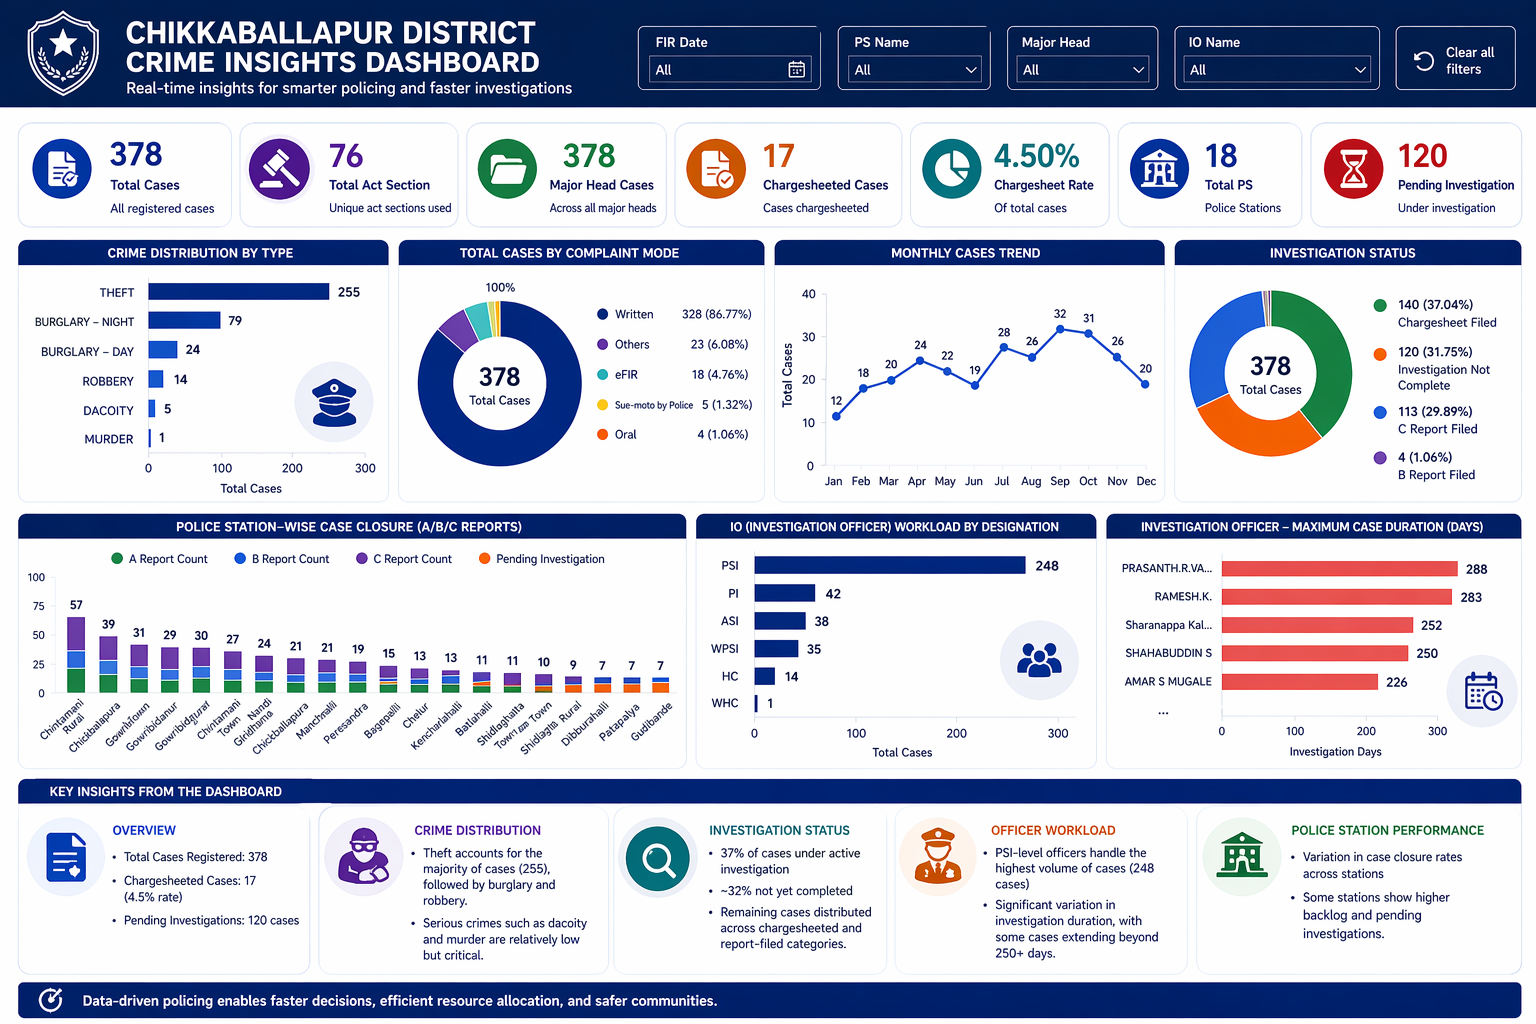
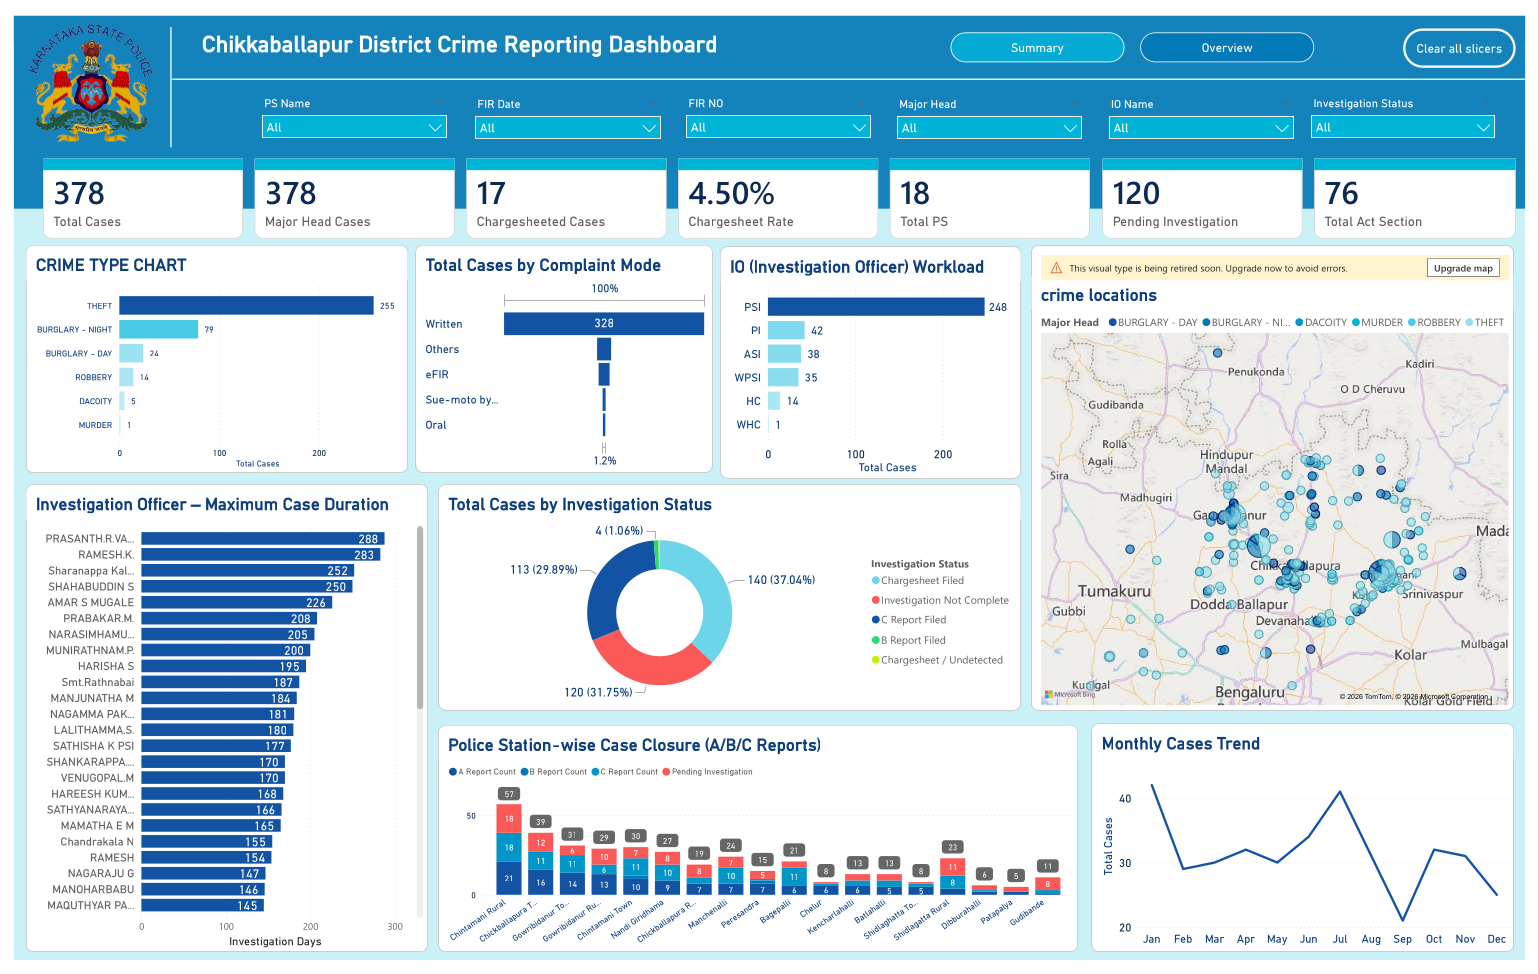
Key Insights from the Dashboard
- Total Cases Registered: 378
- Chargesheeted Cases: 17 (4.5% rate)
- Pending Investigations: 120 cases
When the department consolidated its crime data into a unified dashboard, a clearer operational picture began to emerge. Of the 378 registered cases, only 17 had progressed to chargesheets—a low 4.5% conversion—while nearly 37% remained under active investigation and another ~32% were yet to be completed. This visibility highlighted the scale of pending work and the need for more streamlined investigation processes.
At a deeper level, the data revealed patterns that were previously difficult to detect. Theft dominated the crime landscape, while serious offenses like dacoity and murder, though fewer in number, required critical attention. Workload imbalances also became evident, with PSI-level officers handling the majority of cases and some investigations extending beyond 250 days. Variations in case closure rates across police stations further pointed to operational inefficiencies and backlogs, offering clear direction for targeted improvements.
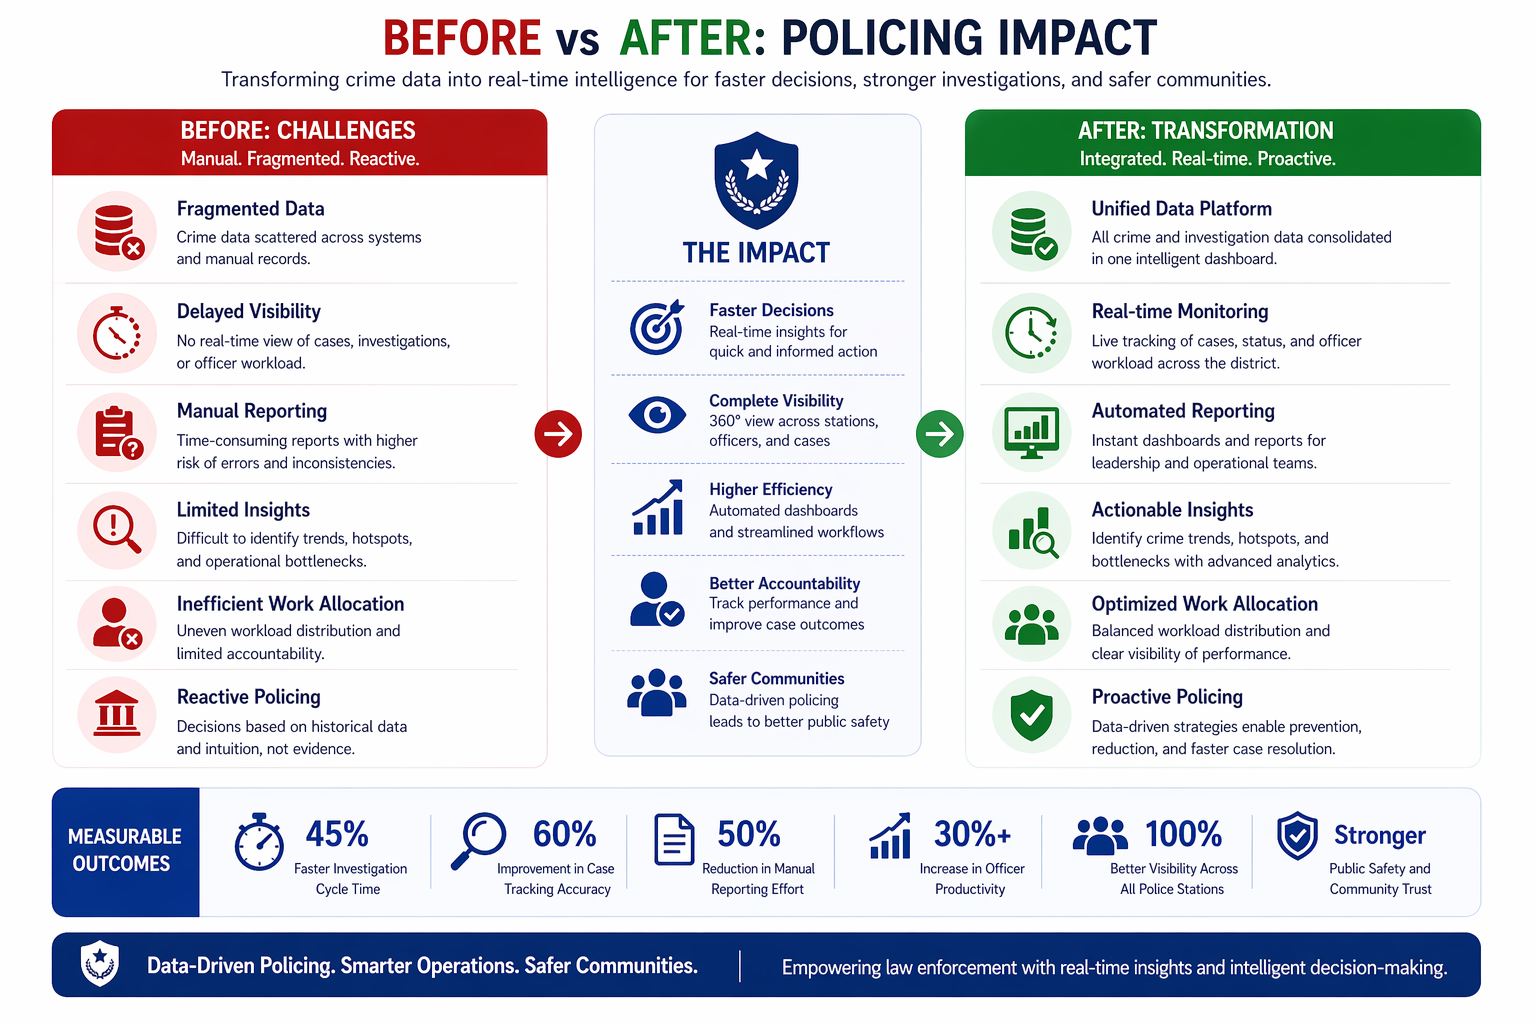
Outcome
With the introduction of a visual, interactive intelligence layer, the department moved beyond fragmented reporting to a more structured and data-driven approach to investigation management. What was once scattered information is now actionable insight—bringing greater transparency into ongoing cases, improving accountability across officers and stations, and enabling faster identification of bottlenecks. As a result, decision-making has become more proactive and precise, powered by real-time visibility into operations.